# S127
## Introduction
This document is intended to help customers or partners with the initial configuration of a physical Vectra Sensor appliance. This is limited to basic network connectivity. This appliance can only be deployed in Sensor mode. Modes are discussed further in the deployment guide for your chosen UX. One of the below guides should be the starting point for your overall Vectra deployment:
* [Respond UX Deployment Guide](https://docs.vectra.ai/deployment/getting-started/respond-ux-deployment-guide)
* [Quadrant UX Deployment Guide](https://docs.vectra.ai/deployment/getting-started/quadrant-ux-deployment)
Full details on firewall requirements for your entire Vectra deployment are available in those guides or in [firewall requirements](https://docs.vectra.ai/deployment/getting-started/firewall-requirements).
After you have completed the initial deployment of your Sensor following this guide, you can move on to paring your Sensor with your Brain appliance. Pairing for all Vectra appliances is covered in [pairing appliances](https://docs.vectra.ai/deployment/appliance-operations/pairing-appliances).
Guide for other appliances are located in [NDR physical appliances](https://docs.vectra.ai/deployment/ndr-physical-appliances) and [NDR virtual / cloud appliances](https://docs.vectra.ai/deployment/ndr-virtual-cloud-appliances).
## S127 Package Contents
* 1 S127 system with rail kit
* 2 power supply cords (matching requested type)
* Vectra bezel
* SFPs and QSFPs (matching details of your order)
* See [SFPs and QSFPs supported in Vectra appliances](https://docs.vectra.ai/deployment/ndr-physical-appliances/supported-sfps-and-qsfps) for options and additional detail.
## Physical Connections
S127 Back Panel (click to enlarge)

### Physical Connections Added Guidance
* If you have questions about rail installation, please watch this [video](https://www.youtube.com/watch?v=JfOTnRMeE5w).
* The S127 has two SSDs on the front left side of the appliance. They are numbered 0 and 1, top to bottom.
* Should either drive ever require replacement, please work with Vectra support.
* Sensor appliances do NOT have a Graphical User Interface, please see [Accessing the CLI](#accessing-the-cli) for details on how to connect to the CLI.
* Once paired to a Brain, most Sensor management is done via the Vectra UI in *Configuration → COVERAGE → Data Sources → Network → Sensors*.
### Minimum Connections Required
Any SFPs that were included in your order will be in the top cardboard tray above the appliance itself.
* Power
* The S127 has two redundant power supplies. It is recommended to connect both.
* MGT1 – SFP28
* This is the port that will need to be configured with an IP address in your network for pairing and ongoing communication with your Vectra Brain.
* Capture - QSFP28
* At least one of the capture interfaces (ports) must have a supported SFP installed in it.
## Performance
| **Sensor Mode** | **Sensor (Match) Mode** |
| :-------------: | :---------------------: |
| 58 Gbps | 30 Gbps |
**Definitions:**
* **Sensor Mode** – Bandwidth number shown refers to the amount of network traffic observed that the appliance can produce metadata for (capture bandwidth).
* **Sensor (Match) Mode** – Performance as a Sensor with [Match](https://docs.vectra.ai/deployment/match/deployment) or [Suspect Protocol Activity Detections](https://docs.vectra.ai/operations/general/suspect-protocol-activity-detections-feature-overview) enabled.
{% hint style="info" %}
**Please Note:**
While considering performance for the Sensor it is important to understand that the traffic mix at customer sites varies widely. Some customers have traffic mixes that skew towards larger flows (think file transfers), and some will skew towards smaller flows (think DNS).
* Performance may be higher when the traffic mix skews towards larger flows.
* Performance will be lower when the traffic mix skews towards smaller flows as this produces more metadata for analysis.
* The stated performance is for average traffic mixes and should not be considered absolute.
{% endhint %}
## Accessing the CLI
The Command Line Interface (CLI) of a physical Vectra appliance is accessible in multiple ways. All appliances will not always have all methods available. See [physical connections](#physical-connections) to see the options available for your specific model.
* KVM or “crash cart”
* Direct connection to "Support" (MGT2) port
* iDRAC/IPMI - not all appliance types will have iDRAC/IPMI
* MGT1 port once configured
* Serial console - only supported officially on S1, S2 (EOL), X29/M29, and the X80 (EOL) appliances.
Once you have connected to the CLI login prompt on the appliance, use the default credentials to login.
* Username: `vectra` and password: `changethispassword`
* Please change the password immediately after logging in using the `set password` command.
### KVM or “crash cart”
If your appliance has USB and VGA ports, a KVM (Keyboard, Video, Mouse) switch or “crash cart” can be used to connect to the appliance console.
### Direct Connection to "Support" (MGT2) Port
A direct connection to the MGT2 port on your appliance.
* If you can physically connect to your MGT2 port, then you can direct connect to the MGT2 port via SSH to do the initial configuration.
* The appliance MGT2 port is factory configured with a 169.254.0.10/16 (255.255.0.0) address.
* Configure your host’s IP to 169.254.0.11 with subnet mask of 255.255.0.0.
* Use SSH to connect to the appliance from your host using the default credentials from above.
### iDRAC/IPMI
If your appliance has a built in Dell iDRAC / IPMI interface you can access the CLI through it.
{% hint style="info" %}
Vectra strongly recommends that customers configure iDRAC / IPMI access permanently for all platforms supporting this interface.
Benefits:
* Easier access in case of network connectivity issues or DHCP mishaps.
* Simpler remote IP address changes.
* Reduced resolution time during Vectra support engagements requiring console access.
{% endhint %}
Please expand for iDRAC/IPMI configuration details:
The default username / password for iDRAC/IPMI is `vectra` / `changethispassword`.
To access the interface, point your web browser to ****
* Initially, your iDRAC interface will default to DHCP.
At the login screen enter your credentials:

Click on the **Virtual Console**:

And you will be presented with a login prompt for the CLI:

To set a static IP for iDRAC you must 1st be logged in to the CLI of the Sensor as the `vectra` user:
```
Command:
show ipmi_interface
Example Output:
Gateway: 10.2.0.1
Ip: 10.2.2.32
Mac: d0:94:66:48:0a:ad
Mode: static
Netmask: 255.255.0.0
To set the IPMI / iDRAC interface the command syntax and an example are shown below:
Syntax example:
set ipmi_interface -h
Usage: set ipmi_interface [OPTIONS] [dhcp|static] [IP_ADDRESS] [SUBNET_MASK] [GATEWAY_ADDRESS]
Set the ipmi interface config
Options:
-h, --help Show this message and exit.
Command Example (Static Addressing):
set ipmi_interface static 10.2.2.34 255.255.248.0 10.2.0.1
IPMI Interface Change: success
Command Example (DHCP):
set ipmi_interace dhcp
IPMI Interface Change: Success
```
### Serial Console
{% hint style="info" %}
Serial console is only supported on S1, S2 (EOL), X29/M29, and X80 (EOL) appliances.
{% endhint %}
If supported on your appliance model, the serial settings should be 115,200, 8, N, 1
* 115,200 baud data rate
* 8 data bits
* No parity bit
* 1 stop bit
* Do not enable flow control
## Initial Network Configuration
### DHCP
The appliance can obtain its network configuration from a DHCP server in your network. The MGT1 port functions as a DHCP client by default.
* Connect the management port (MGT1) of the appliance to the network switch.
* Find the IP address that was assigned to MGT1 from your DHCP server logs.
* You can also find the IP address at the CLI of your appliance if you can access it another way .
* Use the `show interface` command to display the address that was assigned to MGT1 via DHCP once you are logged onto the appliance.
* See Accessing the Command Line Interface (CLI) of the Appliance above for instructions on how to log on).
### Static Addressing
#### Configuration Checklist for Static Addressing
Below is a list of information needed for the initial configuration:
* IP address to be used for the MGT1 interface
* Default gateway IP address
* DNS nameserver IP addresses
* DNS servers for the Sensor must be configured at the CLI if you are not using DHCP. This cannot be done in your Brain.
#### Setting a Static MGT1 IP Address
Once logged in to the appliance you can view the syntax for the `set interface` command:
```
set interface -h
Usage: set interface [OPTIONS] {mgt1|mgt2} {dhcp|static} [IP] [SUBNET_MASK]
[GATEWAY_ADDRESS]
Sets network interfaces to either dhcp or static ip configuration
Options:
-h, --help Show this message and exit.
```
Setting the IP address example:
```
set interface mgt1 static 10.50.10.10 255.255.255.0 10.50.10.1
```
#### IPv6 Support:
IPv6 is supported for the MGT1 and MGT2 interfaces. For full details, including information regarding dual stack support, please [IPv6 Management Support for Vectra Appliances](https://docs.vectra.ai/deployment/getting-started/ipv6-management-support-for-vectra-appliances) on the Vectra support portal. Below we will show how to enable IPv6 support (its off by default) and the syntax to use when setting an IPv6 address.
To enable/disable IPv6 support:
```
# show ipv6 enabled
IPv6 is disabled
# set ipv6 enabled
Response: ok
# show ipv6 enabled
IPv6 is enabled
# set ipv6 disabled
Response: ok
```
Setting IPv4 and IPv6 syntax examples:
Execute the following command to set the MGT1 or MGT2 (a gateway address cannot be configured for MGT2, the gateway on MGT1 will be used) interface to the desired static IP address:
```
IPv4 Syntax:
set interface mgt1 static x.x.x.x y.y.y.y z.z.z.z
set interface mgt2 static x.x.x.x y.y.y.y
Where:
x.x.x.x is the desired interface IP address
y.y.y.y is the desired interface network mask
z.z.z.z is the desired gateway
IPv6 Syntax:
set interface mgt1 static [IPv6 IP] [Subnet Mask] [Gateway]
Example:
set interface mgt1 static 2001:0db8:0:f101::25 64 2001:0db8:0:f101::1
```
#### Configuring DNS for the appliance:
Command syntax to set DNS (up to 3 nameservers are supported):
```
set dns [nameserver1 ] [nameserver2 ] [nameserver3 ]
```
Configuring DNS Example:
```
set dns 10.50.10.101 10.50.10.102
```
Verifying DNS Configuration:
```
show dns
```
### Verifying your Connectivity:
Once you have configured an IP statically or via DHCP you can verify connectivity by pinging known IPs in your environment from the CLI with the `debug ping` command.
If your Sensor is already configured with an IP, it is recommended to ping the Brain IP to verify reachability before attempting pairing. Sensors must have port 22 and 443 open from the Sensor to your Brain for successful pairing and ongoing communication. Connectivity can be tested with the `debug connectivity` command.
* For more detail, please see [Checking brain or sensor network connectivity](https://support.vectra.ai/vectra/article/KB-VS-1280).
**Example:**
```
vscli > debug connectivity -h
Usage: debug connectivity [OPTIONS] HOST PORT
Test TCP connectivity to destination host or IP through proxy if configured
Options:
--bypass-proxy / --dont-bypass-proxy
Bypass proxy while testing connectivity if
proxy is configured
--ssl / --no-ssl Test connectivity to host using SSL
--timeout FLOAT Seconds to attempt a connection to host and
proxy if configured [default: 5]
-h, --help Show this message and exit.
vscli > debug connectivity yourbrainIP.customernetwork.com 443 –no-ssl
Connectivity: Success
Proxy: False
SSL: False
```
## Next Steps
### Brain and Sensor Communications Requirements
A Sensor (or Stream appliance) can pair with any Vectra Brain type. For example, the Brain can be a physical appliance, a Brain deployed in a IaaS cloud, or a Brain deployed in a traditional hypervisor environment on customer premises.
Sensors must be able to reach the Brain over the below ports. It is recommended to enable these ports bidirectionally to aid in troubleshooting.
* TCP/443 (HTTPS) - Used for Sensor discovery and initial pairing connection.
* TCP/22 (SSH) - Used for Paired Sensor connections.
Additionally, for online pairing (physical Sensors only), both the Sensor and Brain must be able to communicate with:
* update2**.**vectranetworks**.**com or 54.200.156.238 over TCP/443 (HTTPS)
Please work with your security and networking contacts to ensure that the Sensor will be able to initiate a connection to the Brain. Sensors only communicate with the Vectra Brain and do not need to communicate to Vectra directly. Software updates for the Sensor will come from the Brain.
For full details on all potential firewall requirements in Vectra deployments, please see [firewall requirements](https://docs.vectra.ai/deployment/getting-started/firewall-requirements).
### Pairing the Sensor to the Brain
After base configuration, it is suggested to pair your Sensor with your Brain appliance.
* [Pairing appliances](https://docs.vectra.ai/deployment/appliance-operations/pairing-appliances) covers pairing of all physical Vectra appliances.
### Traffic Capture Guidance
{% hint style="info" %}
If capture ports are connected before pairing is completed, the Sensor will not buffer any traffic.
{% endhint %}
Simply point the traffic to be captured to your Sensor capture interfaces (ports). The Sensor will begin creating a metadata stream that will be analyzed by your Brain appliance. Sensors also have a rolling capture buffer that the Brain will request PCAPs from. The PCAPs will be attached as evidence with network detections as they are created.
Additionally, [Vectra packet capture](https://docs.vectra.ai/deployment/traffic-engineering-and-validation/using-vectra-packet-capture-pcap) allows users to configure PCAPs to be downloaded from the Brain for analysis with 3rd party tools such as Wireshark.
**Guidance:**
* See [physical connections](#physical-connections) for the interfaces supported for capture use.
* Out of band deployment is the only supported method of traffic capture.
* There is no inline mode for currently supported Vectra Sensor appliances.
* Traffic is typically forwarded to the Sensor via SPAN/COPY/MIRROR, traditional network TAPs, or 3rd party packet brokers.
* Capture ports do not get assigned IP addresses.
* The `show traffic stats` command, available at the Sensor’s CLI, may be useful to see if your traffic capture is successful before you can see the traffic graphs in your Brain’s GUI.
* See [Traffic Graph showing no traffic (0 Mbps)](https://support.vectra.ai/vectra/article/KB-VS-1177) for more details.
* See [Vectra NDR (Detect) and Network Identity Architecture Overview](https://docs.vectra.ai/deployment/getting-started/ndr-network-identity-architecture) for architecture guidance.
* See [Vectra Platform Network Traffic Recommendations](https://docs.vectra.ai/deployment/traffic-engineering-and-validation/network-traffic-recommendations) for what to capture.
* See [Asymmetry concerns in Vectra sensor feeds](https://docs.vectra.ai/deployment/traffic-engineering-and-validation/asymmetry-concerns) for guidance around asymmetric flows.
* See [Traffic Validation (ENTV)](https://docs.vectra.ai/deployment/traffic-engineering-and-validation/traffic-validation-entv) for details on validating your traffic quality.
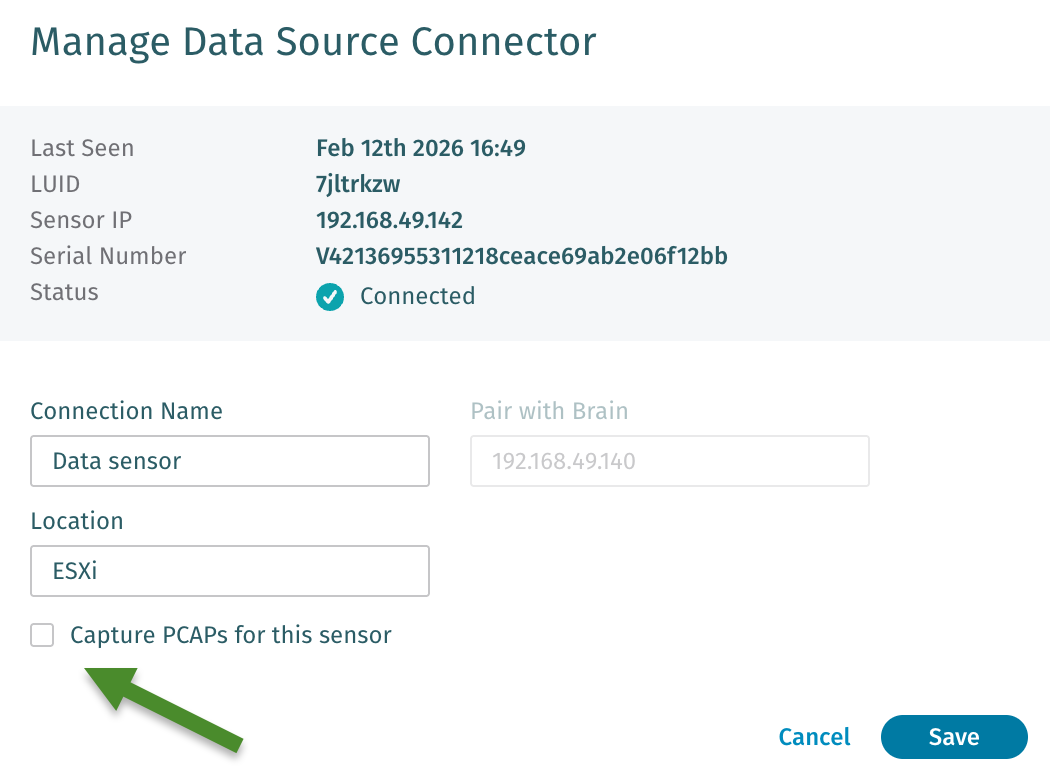
If required, Sensors can be configued to not allow PCAP creation when there are regulatory or privacy concerns. Navigate to *Configuration → COVERAGE → Data Sources → Network → Sensors* in your Vectra UI and edit the desired Sensor. Ensure the checkbox shown below is checked for Sensors you do not wish to perform any PCAP functions and then save your Sensor configuration:
## Worldwide Support Contact Information
* Support portal: [https://support.vectra.ai](https://support.vectra.ai/)
* Email: (preferred contact method)
* Additional information: