> For the complete documentation index, see [llms.txt](https://docs.vectra.ai/llms.txt). Markdown versions of documentation pages are available by appending `.md` to page URLs; this page is available as [Markdown](https://docs.vectra.ai/deployment/ndr-virtual-cloud-appliances/nutanix-vsensor/traffic-capture-and-validation.md).
# Traffic capture and validation
Guidance for Nutanix vSensor traffic capture, PCAP generation, and traffic validation.
## Introduction
How to configure Nutanix for the capture of traffic by vSensors was discussed in the [Service Chaining 1.0](/deployment/ndr-virtual-cloud-appliances/nutanix-vsensor/service-chaining-1.0-deployment.md) and [Traffic Mirroring](/deployment/ndr-virtual-cloud-appliances/nutanix-vsensor/traffic-mirroring-deployment.md) deployment methods. The below is added guidance for all vSensors (not just Nutanix).
Please see those sections linked above for details on how to configure your Nutanix environment to forward network traffic to your Nutanix vSensors for capture and further analysis.
## Traffic Capture Guidance
{% hint style="info" %}
If capture ports are connected before pairing is completed, the Sensor will not buffer any traffic.
{% endhint %}
As long as you are paired with a Brain appliance, once the vSensor begins seeing traffic on any of its capture ports, it will begin creating a metadata stream that will then be forwarded to the Brain for further processing. Sensors also have a rolling capture buffer that the Brain will request PCAPs from. The PCAPs will be attached as evidence with network detections as they are created.
Additionally, [Vectra packet capture](/deployment/traffic-engineering-and-validation/using-vectra-packet-capture-pcap.md) allows users to configure PCAPs to be downloaded from the Brain for analysis with 3rd party tools such as Wireshark.
**Guidance:**
* Capture ports do not get assigned IP addresses.
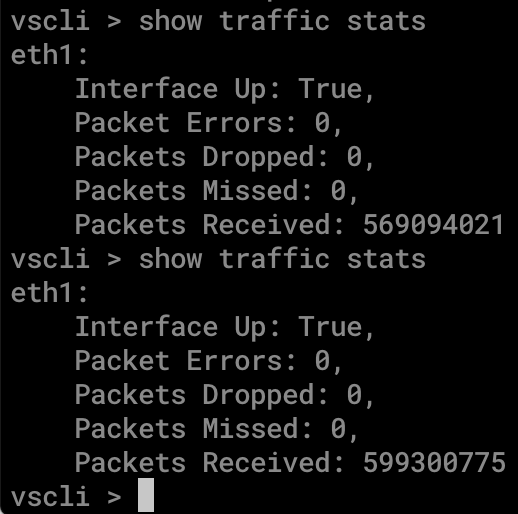
* The `show traffic stats` command, available at the Sensor’s CLI, may be useful to see if your traffic capture is successful before you can see the traffic graphs in your Brain’s GUI.
* See [Traffic Graph showing no traffic (0 Mbps)](https://support.vectra.ai/vectra/article/KB-VS-1177) for more details.
* See [Vectra NDR (Detect) and Network Identity Architecture Overview](/deployment/getting-started/ndr-network-identity-architecture.md) for architecture guidance.
* See [Vectra Platform Network Traffic Recommendations](/deployment/traffic-engineering-and-validation/network-traffic-recommendations.md) for what to capture.
* See [Asymmetry concerns in Vectra sensor feeds](/deployment/traffic-engineering-and-validation/asymmetry-concerns.md) for guidance around asymmetric flows.
## **Turning off PCAP generation**
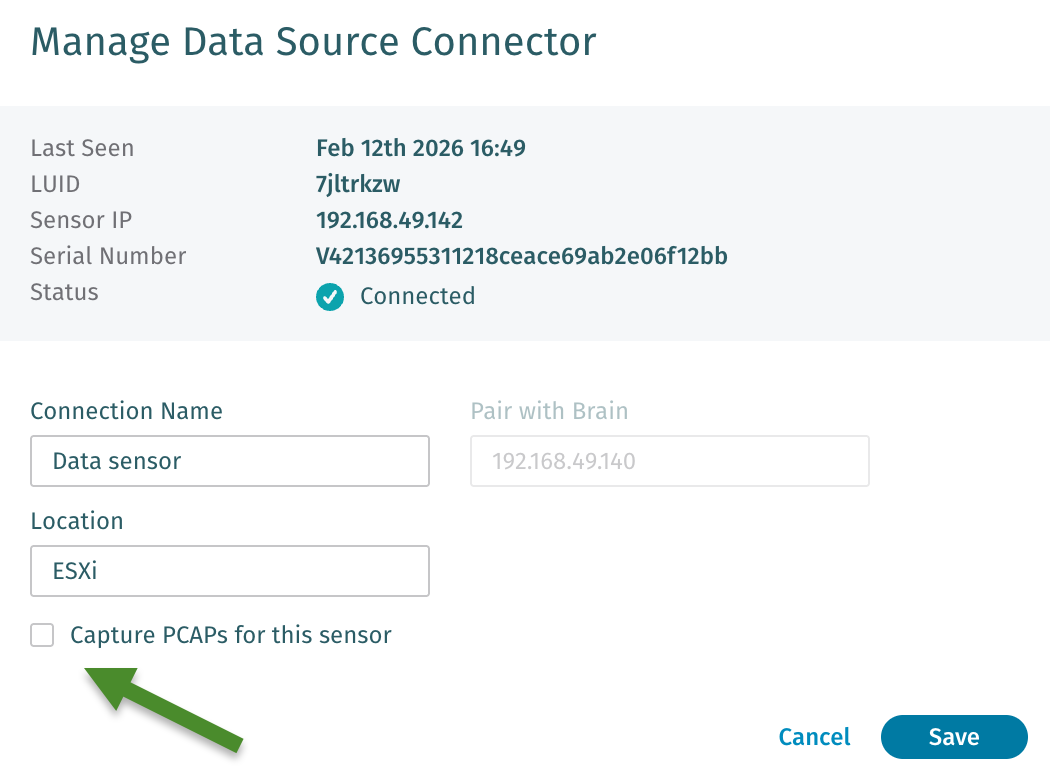
If required, Sensors can be configured to not allow PCAP creation when there are regulatory or privacy concerns. Navigate to *Configuration → COVERAGE → Data Sources → Network → Sensors* in your Vectra UI and edit the desired Sensor. Ensure the checkbox shown below is checked for Sensors you do not wish to perform any PCAP functions and then save your Sensor configuration:
## Traffic Validation
For a quick spot check to see that you are receiving any traffic at all via the vSensor you many want to check the GUI and/or CLI for statistics. If the vSensor is seeing more than 1 Mbps of traffic, this will show in the GUI under *Network Stats > Ingested Traffic* after a few minutes.

* You can see traffic flow immediately at the CLI of the Sensor using the `show traffic stats` command.
* Please note that this command will only function after the vSensor has been paired and updated from the Brain. For details, please see details about the intial embryo state of vSensors in your vSensor deployment guide.
* Execute this command a few times in a row to see increasing packet counts.
After sending traffic to your Sensors, it is a best practice to validate that the traffic observed meets quality standards required for accurate detection and processing. Vectra’s Network Traffic Validation feature provides alarms and metrics that can be used to validate the quality of your traffic. See [Traffic Validation (ENTV)](/deployment/traffic-engineering-and-validation/traffic-validation-entv.md) for details on validating your traffic quality.
{% hint style="success" %}
You have completed the Nutanix vSensor deployment.
{% endhint %}
* **Support portal:** [https://support.vectra.ai](https://support.vectra.ai/)
* **Email:** (preferred contact method)
* **Additional information:**
---
# Agent Instructions
This documentation is published with GitBook. GitBook is the documentation platform designed so that both humans and AI agents can read, navigate, and reason over technical content effectively. Learn more at gitbook.com.
## Querying This Documentation
If you need additional information that is not directly available in this page, you can query the documentation dynamically by asking a question.
Perform an HTTP GET request on the current page URL with the `ask` query parameter, and the optional `goal` query parameter:
```
GET https://docs.vectra.ai/deployment/ndr-virtual-cloud-appliances/nutanix-vsensor/traffic-capture-and-validation.md?ask=&goal=
```
`ask` is the immediate question: it should be specific, self-contained, and written in natural language.
`goal` is optional and describes the broader end goal you are ultimately trying to accomplish on behalf of the user. GitBook uses it to tailor the answer towards what is most useful for that goal.
The response will contain a direct answer to the question and relevant excerpts and sources from the documentation.
Use this mechanism when the answer is not explicitly present in the current page, you need clarification or additional context, or you want to retrieve related documentation sections.
 After sending traffic to your Sensors, it is a best practice to validate that the traffic observed meets quality standards required for accurate detection and processing. Vectra’s Network Traffic Validation feature provides alarms and metrics that can be used to validate the quality of your traffic. See [Traffic Validation (ENTV)](/deployment/traffic-engineering-and-validation/traffic-validation-entv.md) for details on validating your traffic quality.
{% hint style="success" %}
You have completed the Nutanix vSensor deployment.
{% endhint %}
* **Support portal:** [https://support.vectra.ai](https://support.vectra.ai/)
* **Email:**
After sending traffic to your Sensors, it is a best practice to validate that the traffic observed meets quality standards required for accurate detection and processing. Vectra’s Network Traffic Validation feature provides alarms and metrics that can be used to validate the quality of your traffic. See [Traffic Validation (ENTV)](/deployment/traffic-engineering-and-validation/traffic-validation-entv.md) for details on validating your traffic quality.
{% hint style="success" %}
You have completed the Nutanix vSensor deployment.
{% endhint %}
* **Support portal:** [https://support.vectra.ai](https://support.vectra.ai/)
* **Email:**